

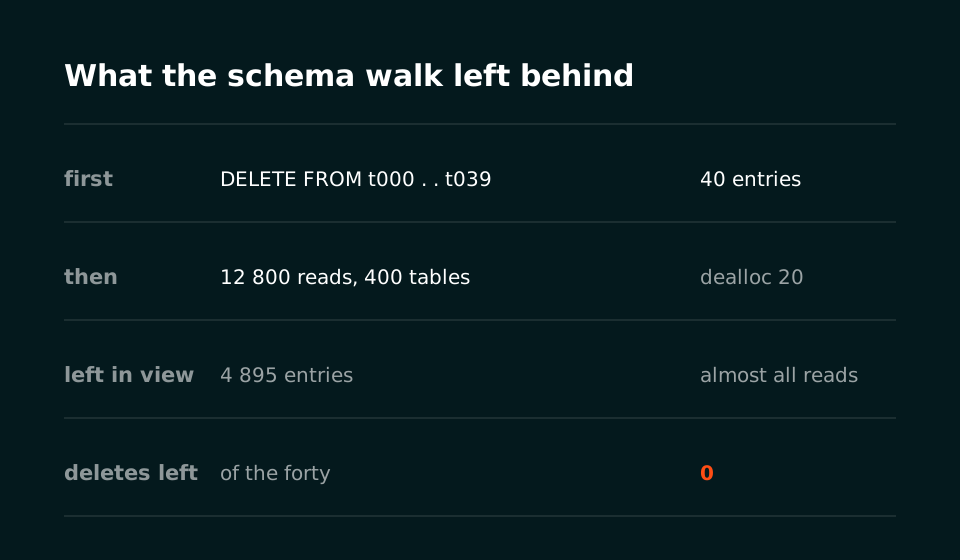
On the server this article was written against, pg_stat_statements_info.dealloc reads 20, and that counter is all the database has left to say about forty rows an agent deleted. The forty entries were there while the DELETE statements ran, one per table, counted and timed like anything else. Then the same agent read the schema twice over, 12 800 statements that changed not one row, and the reading needed room.
The eviction is documented behaviour rather than a defect. The view is sized once, at 5 000 entries by default, and once more distinct statements arrive than that the documentation says "information about the least-executed statements is discarded". Run once, a statement is the least-executed thing in the database.
Ordinary application traffic sits at the far end of the axis that policy implies, since an application issues a small set of statements a great many times each. An agent writing its SQL fresh on every turn does the reverse, and the rewriting adds a second cost on top, because a question asked in two shapes occupies two entries and each of those two has been called once.
Key Takeaways
- Twelve ways of asking one question produced eight entries. Lowercase keywords, reflowed whitespace, a leading
--comment and apublic.prefix all merged into the baseline, whilecount(1), a table alias, a swapped predicate order, a subquery and a CTE each took an entry of their own. - Two tenant schemas whose same-named tables hold 100 and 100 000 rows share one
queryidon PostgreSQL 18, where 17 kept them apart, and the surviving entry carries the name of whichever schema was queried first. - Nothing in the view names the caller beyond its role. Two connections under one role, one with
application_nameset topayments-apiand one toclaude-agent, landed in the same entry, so an agent borrowing the application's login cannot be separated from it after the fact. - With
trackat its defaulttop, a statement inside a PL/pgSQL function or aDOblock leaves no entry of its own, and the same holds for four statements that raised errors. - Flooding the view past its ceiling raised
deallocwhile the application's own entries stayed, both a 500-call hot query and a report that had run once. The flood took the forty one-off writes instead, reaching them because they named forty different tables. - Where the view cannot answer, the log can, since
log_line_prefixcarrying%uand%atogether withlog_min_duration_statementrecords the role, theapplication_nameand the literal values.
One container produced every number here, PostgreSQL 18.6 built on 22 September 2026, with 17.11 and 19beta3 re-running each script wherever the version changed the answer.
One question, eight entries in the view
Constants are stripped before the identifier is computed, so three calls carrying three different customer ids arrive as one entry, which disposes of literal-heavy SQL as a cause of near-duplicates.
SELECT count(*) FROM orders WHERE customer_id = 42;
SELECT count(*) FROM orders WHERE customer_id = 77;
SELECT count(*) FROM orders WHERE customer_id = 313;

 calls |                       query
-------+----------------------------------------------------
     3 | SELECT count(*) FROM orders WHERE customer_id = $1
(1 row)
What splits an entry is any change to the parse tree, and a model rewriting its own SQL changes that tree far more often than a person editing a query by hand. Twelve shapes of one question, "how many orders does customer 42 have", produced eight entries.
| How the question was written | Result |
|---|---|
SELECT count(*) FROM orders WHERE customer_id = 42 | the baseline entry |
| the same statement in lowercase keywords | merged |
| the same statement reflowed across three lines | merged |
the same statement under a leading -- comment | merged |
FROM public.orders in place of FROM orders | merged |
SELECT count(1) in place of count(*) | its own entry |
FROM orders o WHERE o.customer_id = 42 | its own entry |
WHERE customer_id >= 42 AND customer_id <= 42 | its own entry |
WHERE status = 'new' AND customer_id = 42 | its own entry |
WHERE customer_id = 42 AND status = 'new' | its own entry |
FROM (SELECT id FROM orders WHERE customer_id = 42) s | its own entry |
WITH c AS (SELECT * FROM orders WHERE customer_id = 42) SELECT count(*) FROM c | its own entry |
Read the merged half and the machine looks forgiving, since everything a formatter or a linter would touch comes back as one row. The cost lives in the split half, and the instructive pair is the two predicate orders, adjacent rows in the table above and identical in every respect a reader would care about. Because swapping two conditions joined by AND changes the tree, Postgres computes a different queryid for each order. The trees really do differ, so the implementation is within its rights. The consequence lands on whoever reads the view later, since an agent with no reason to emit its predicates in a stable order spreads one piece of work across rows that nothing marks as related.
Lists of constants changed hands in PostgreSQL 18, and the change merges more than it splits. Two statements that differ only in how many ids they look up now share an entry, with a comment standing in for the elements that were dropped.
SELECT count(*) FROM orders WHERE id IN (1,2,3);
SELECT count(*) FROM orders WHERE id IN (1,2,3,4,5,6,7);
SELECT count(*) FROM orders WHERE id IN (900);

 calls |                          query
-------+---------------------------------------------------------
     2 | SELECT count(*) FROM orders WHERE id IN ($1 /*, ... */)
     1 | SELECT count(*) FROM orders WHERE id IN ($1)
(2 rows)
The release note behind it reads "Have query id computation of constant lists consider only the first and last constants", and on 17.11 the same three statements produce three rows, IN ($1), IN ($1,$2,$3) and IN ($1,$2,$3,$4,$5,$6,$7). Note the leftover in the 18 output, though, because a single-element list is not treated as a list at all and keeps a row to itself.
Two tenants, one queryid
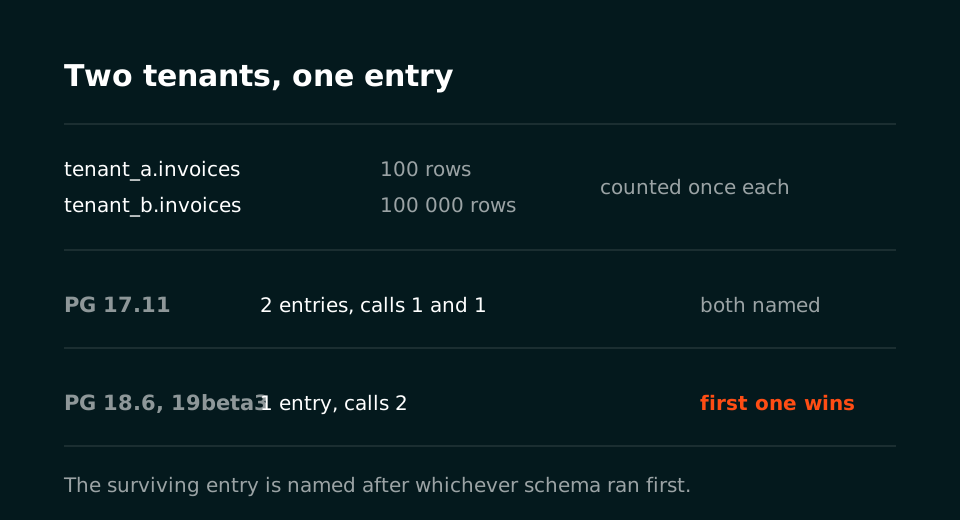
A schema per tenant is common enough, and the tables inside those schemas usually share their names. Two of them here, tenant_a.invoices with 100 rows and two columns, tenant_b.invoices with 100 000 rows and three, were each counted once under their own search_path.
SET search_path = tenant_a;
SELECT count(*) FROM invoices WHERE id > 5;
SET search_path = tenant_b;
SELECT count(*) FROM invoices WHERE id > 5;

       queryid       | calls | rows |                    query
---------------------+-------+------+---------------------------------------------
 9114093936963880505 |     2 |    2 | SELECT count(*) FROM invoices WHERE id > $1
(1 row)
One entry now carries both calls, so a 100-row table and a 100 000-row table have their timings averaged together inside it. Naming the schemas explicitly does not separate them either, and the entry that comes back then reads SELECT count(*) FROM tenant_a.invoices WHERE id > $1 against the same queryid, which is the part to be careful about when reading a dashboard, since that text is a copy of whichever statement created the entry rather than a description of the statements now being counted in it. With the tenant_b query run first, the row carries the label tenant_b.invoices while still counting both.
PostgreSQL 17.11 answered the same script with two entries, queryid 27677043242712635 and 5622856266958512818, and naming the schemas explicitly there gave each of them its own correct text. The merge arrived in 18 as "Adjust query id computations to group together queries using the same relation name", whose note adds that this holds "even if the tables in different schemas have different column names". On 19beta3 the behaviour is the same and the number is different again, -6590361220937067171, so a major upgrade also starts this history from nothing.
The same release took away the other handle on tenancy. Setting a tenant key used to leave its value in the view, one entry per distinct value, and the value is now a placeholder.
SET app.tenant = 'alpha';
SET app.tenant = 'beta';
SET statement_timeout = '3s';
SET statement_timeout = '9s';
RESET statement_timeout;

 calls |          query
-------+-------------------------
     1 | RESET statement_timeout
     2 | SET app.tenant = $1
     2 | SET statement_timeout = $1
(3 rows)
On 17.11 those two app.tenant lines produce SET app.tenant = 'alpha' and SET app.tenant = 'beta' as separate rows, which is how an operator could once tell from statistics alone which tenants a pooled worker had served. A busy multi-tenant server no longer burns thousands of entries on per-tenant noise. Both mechanisms took the tenant out of the answer at the same time, the schema name and the SET value together, so an operator reading statistics alone has lost the handle 17 gave them.
The view has no application_name column
Of the fifty-two columns in the view, the grouping key is the first four, userid, dbid, toplevel and queryid, and nothing among the remaining forty-eight identifies a connection, a session, a client address or an application_name. Put two connections under the role app, one announcing itself as payments-api and the other as claude-agent, and an identical statement from each lands in one row, while the role agent running the very same text opens a second entry.
 grouped_by_role | calls |                       query
-----------------+-------+----------------------------------------------------
 agent           |     1 | SELECT count(*) FROM orders WHERE customer_id = $1
 app             |     2 | SELECT count(*) FROM orders WHERE customer_id = $1
(2 rows)
Role is the only axis of separation the view offers, which has a blunt consequence for any deployment where the agent reuses the application's connection string. Because the numbers were added together the moment each statement finished, with no breakdown kept, nothing splits those two callers apart afterwards. The role has to exist before the traffic does, since an agent that borrowed the application's login is inside the application's numbers permanently.
<insufficient privilege>
Reading the view from a role without pg_read_all_stats is a different experience from reading it as superuser, since the rows other roles produced are all there with their call counts, and their text is redacted.
 rolname  | calls |          query
----------+-------+--------------------------
 agent    |     1 | <insufficient privilege>
 postgres |     1 | <insufficient privilege>
(2 rows)
Granting pg_read_all_stats restores the text. That grant is the one usually handed to a monitoring role without much thought, and on a server where an agent shares a database with an application it also hands over the text of every statement the application runs.
The statement inside the function never reaches the view
pg_stat_statements.track defaults to top, which records what the client sent and nothing the server reached on its own behalf. Wrap the work in a function and the view keeps only the call.
SELECT orders_for(42);
DO $$ DECLARE n bigint; BEGIN SELECT count(*) INTO n FROM orders WHERE customer_id = 43; END $$;

 toplevel | calls |                              text
----------+-------+----------------------------------------------------------------
 t        |     1 | DO $$ DECLARE n bigint; BEGIN SELECT count(*) INTO n FROM orde
 t        |     1 | SELECT orders_for($1)
 t        |     1 | SELECT pg_stat_statements_reset()
(3 rows)
The SELECT count(*) INTO n FROM orders WHERE customer_id = cid inside that function body is absent, so the table it touched never appears. The DO block keeps its entire text as one utility statement and hides its contents the same way, which matters more than it used to now that a model asked to do several things in one round trip will wrap them in DO $$ ... $$. Setting track to all brings the inner statements back as rows carrying toplevel false, two extra rows for the two wrapped statements here, and the one from inside the function reads WHERE customer_id = cid where the one from the DO block reads = $1, since a PL/pgSQL variable is not a constant for the normalizer to replace. Nested statements then compete for the same 5 000 slots as everything else.
The statements that failed were never counted
Four statements were run in one session, each of them a plausible thing for a model to emit against a schema it has partly misremembered.
SELECT count(*) FROM orders WHERE customer_id = 'not-an-int';
ERROR:  invalid input syntax for type integer: "not-an-int"

SELECT count(*) FROM no_such_table WHERE x = 1;
ERROR:  relation "no_such_table" does not exist

SELECT 1 / 0;
ERROR:  division by zero

INSERT INTO orders(id, customer_id, amount, status) VALUES (1, 1, 1, 'dup');
ERROR:  duplicate key value violates unique constraint "orders_pkey"
DETAIL:  Key (id)=(1) already exists.
Afterwards the view held two rows, one for the single statement in that session that succeeded and one for the reset that had opened it. Recording happens when a statement finishes executing, and none of these finished. For an operator who arrives after an incident wanting to know what the agent tried, the view is silent by construction.
pg_stat_statements.max, dealloc and the forty deletes
The ceiling is a shared memory allocation fixed at startup, and because pg_stat_statements.max carries postmaster context, changing it means a restart that a reload cannot substitute for. To work out how close a real agent gets to 5 000, count shapes instead of statements, since statements sharing a shape share an entry. The walk below goes over 400 tables with sixteen read shapes each, two of which turn out to collide on most tables, something the entry counts imply without naming.
Before the first flood the view held a hot application query at 500 calls. Then 5 120 statements went through, 320 tables at sixteen shapes.
 entries_after | dealloc_after
---------------+---------------
          4805 |             0
(1 row)
Nothing was evicted at that size, and of the 4 805 entries the walk itself accounts for 4 801, fifteen per table bar one that managed sixteen, with the remaining four already in the view when it started. A second run, this time planting a nightly report alongside the hot query before walking all 400 tables, 6 400 statements, crosses the line.
 entries | dealloc
---------+---------
    4755 |       5
(1 row)

 calls |                       survived
-------+------------------------------------------------------
   500 | SELECT count(*) FROM orders WHERE customer_id = $1
     1 | SELECT status, sum(amount) FROM orders GROUP BY stat
(2 rows)
Eviction ran five times during that walk and took neither of the application's entries, the report that had run exactly once included. Going in, the expectation on this stand was that agent traffic would push the application's statistics out of the view, and the run contradicted it, since eviction discards the least-executed entries and a statement at 500 calls is nowhere near that end of the list.
The flood took the agent's own record of its writes instead. Running the schema walk twice, 12 800 read statements, took dealloc to 20, and the forty DELETE statements the run had opened with, one per table and each of them recorded at the time, were no longer there.
 oneoff_writes_recorded
------------------------
                     40
(1 row)

 entries | dealloc
---------+---------
    4895 |      20
(1 row)

 oneoff_writes_surviving
-------------------------
                       0
(1 row)
Naming the mechanism precisely matters here, because it is not the literals. Each of those forty statements read DELETE FROM t### WHERE id = 1, the same value in each, so the jumble would have merged them on that basis alone. Forty different table names kept them apart instead, since PostgreSQL 18's relation-name grouping only reaches same-named tables sitting in different schemas. In a control run, forty deletes against one table, differing only in their literals, normalized into a single entry carrying 40 calls, and that entry survived the identical 12 800-statement flood.
What still answers the question
Turning on log_min_duration_statement, with a log_line_prefix that carries %u and %a, produces the line the view cannot hold, since the role, the database, the client's declared name and the literal value all land in one place.
2026-09-22 10:24:43.980 UTC [355] agent@postgres app=claude-agent LOG:  duration: 1.209 ms  statement: SELECT count(*) FROM orders WHERE customer_id = 4242;
2026-09-22 10:24:44.242 UTC [362] app@postgres app=payments-api LOG:  duration: 1.062 ms  statement: SELECT count(*) FROM orders WHERE customer_id = 4242;
That separation works because the log writes a line per statement where the view keeps a row per shape, so %u and %a each split these two callers on their own. The durations are also a warning against the obvious economy, since the agent's statement and the application's differ by 0.147 ms, and a threshold placed inside a gap that narrow sorts callers by noise. Choosing one means measuring your own latencies rather than assuming the agent is the slow caller.
Give the agent its own role regardless, and do it before the incident that makes you want it. A role separates its rows for as long as they are resident, gives the log a field to filter on that outlives them, shows up in pg_stat_activity, and carries a CONNECTION LIMIT you can turn down. Seedfast creates a role for its own connections, so its statements stay attributable in the log once %u is in the prefix. A role also holds where application_name does not, since the role is recorded at authentication while application_name is a value the session picks for itself.
PostgreSQL 19 adds generic_plan_calls and custom_plan_calls, described in the release notes as generic and custom plan counts, which answers a question the view could not answer before. Neither column addresses the two gaps above, and the queryid renumbering across majors means the upgrade starts the record over, so plan against the version you are actually running.
pg_stat_statements must be loaded via "shared_preload_libraries"
One last trap sits at the front of all of this, and it is the kind an agent asked to "enable query statistics" walks straight into. Creating the extension on a server started without the library preloaded works.
CREATE EXTENSION pg_stat_statements;
CREATE EXTENSION

SELECT count(*) FROM pg_stat_statements;
ERROR:  pg_stat_statements must be loaded via "shared_preload_libraries"
The CREATE EXTENSION succeeds and the catalog entry is real, while reads of the view keep failing until shared_preload_libraries names the library and the server has been restarted. An agent reporting that first command's success as the job being done is describing the command it ran, which is a narrower claim than the one you asked it for.
Frequently asked questions
Why are some of my queries missing from pg_stat_statements?
Most of the missing ones went one of a few ways. A statement that raised an error was never recorded at all, since recording happens when execution finishes. If it ran nested inside a function, procedure or DO block while pg_stat_statements.track sat at its default top, the view kept only what the client sent. And where the entry did exist and was discarded to make room, pg_stat_statements_info.dealloc counts the discards without naming a single casualty.
How many distinct statements does it take before eviction starts?
The threshold is pg_stat_statements.max, which is 5 000 unless someone changed it, and the figure to compare against is shapes, not raw statement counts. On this stand, 5 120 statements over 320 tables came to 4 805 entries with no eviction, while 6 400 statements over 400 tables crossed the line and took dealloc to 5. To size it for your own server, multiply the shapes your agent produces per table by the tables it can reach, then compare that product with the ceiling.
Can I see which application_name ran a statement?
The view has no column for it, since its grouping key stops at userid, dbid, toplevel and queryid. pg_stat_activity carries application_name for sessions currently connected, and the log carries it for everything once log_line_prefix includes %a. For a durable split inside the view itself, the caller needs a role of its own.
Does raising pg_stat_statements.max require a restart?
Raising it takes a restart, because the parameter carries postmaster context and the entries live in a shared memory area sized at startup, which a reload cannot resize. Budget that memory before raising the value, and note that switching pg_stat_statements.track to all adds a row for every distinct nested shape your workload runs, all of them competing for the same ceiling.
Related guides
- Your agent can turn off its own kill switch covers USERSET parameters and why a value pinned onto a role is a starting point rather than a limit,
application_nameamong them. - Your agent is reading someone else's tenant follows the same tenant key through a transaction-mode pooler, where
SEToutlives the caller that issued it. - What replica mode does not switch off is the matrix for
session_replication_role, the superuser-context parameter a role genuinely can be stopped from setting.